
Transform Spreadsheets into Intelligent Insights
Problem
This solution eliminates the operational risk and inefficiency arising from manual data analysis and unstructured reporting workflows. It enables automated KPI generation using Excel/CSV data, and instant dashboard visualisation without dependency on analysts. By centralising unstructured datasets into a structured database. Management commentary is auto-generated using governed AI, ensuring consistency & accuracy. Overall, the tool converts a labour-intensive reporting cycle into a standardised and real-time analytics process.
Prompt Input
Below Prompt will be used on Lovable: Build a secure web app with: 1) a single-page upload interface that accepts XLSX/CSV and shows upload progress; 2) parse each sheet into separate database tables and store in Supabase; 3) a dashboard page that displays selectable KPIs, pivot-style table, and charts generated automatically from uploaded data; 4) an 'Generate Commentary' button that sends computed KPIs and selected filters to Lovable AI and returns a structured management commentary with sections: Executive Summary, Key Drivers, Variance Analysis, Recommendations; 5) user authentication (email) and an admin panel to manage/delete uploaded files. Use best practices for file size limits and data encryption.
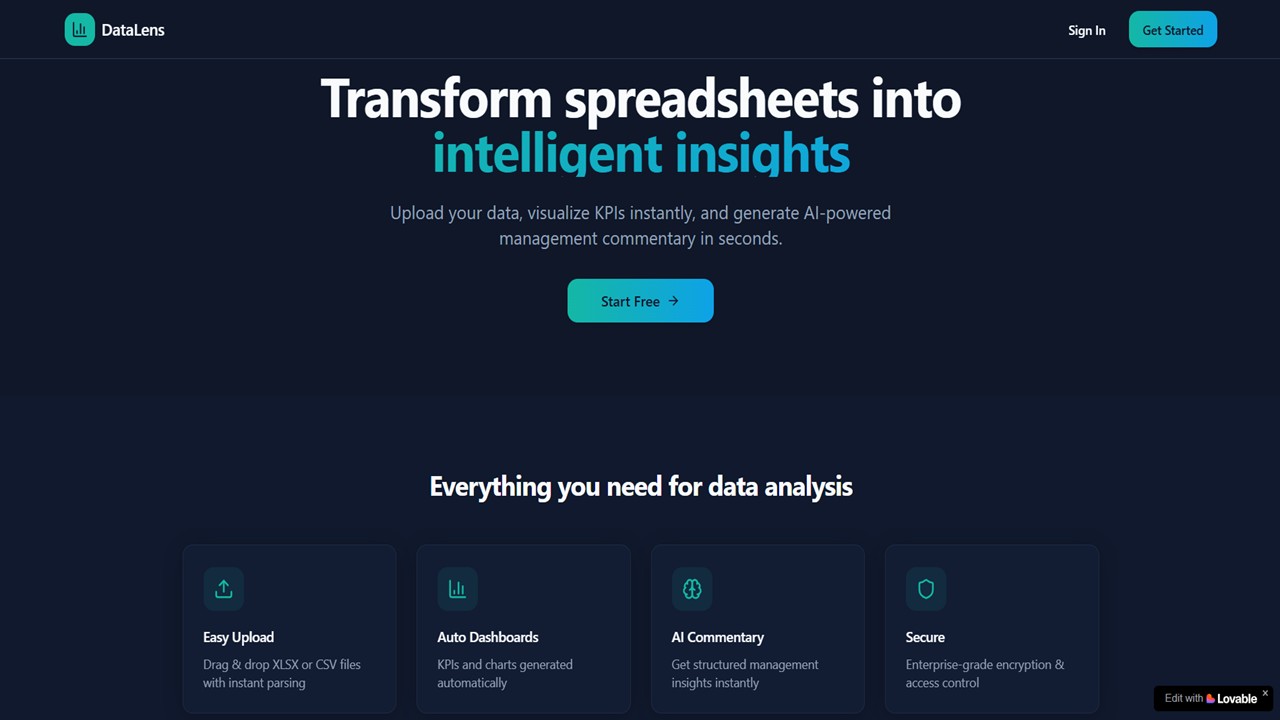
Prompt Output
The system produces an interactive dashboard comprising KPIs, charts, and pivot-style analytics derived from the uploaded data. It automatically computes trends, variances, and performance indicators based on selected filters. A structured management commentary is generated through AI with defined sections—Executive Summary, Key Drivers, Variance Analysis, and Recommendations. The platform also stores the database tables for future reports and allows retrieval in future. The overall output transforms raw Excel data into actionable insights, visual analytics, and consistent narrative reporting.